The Handy Histogram (And Why We Should Use It)
May 31, 2018 by Marie Joabar
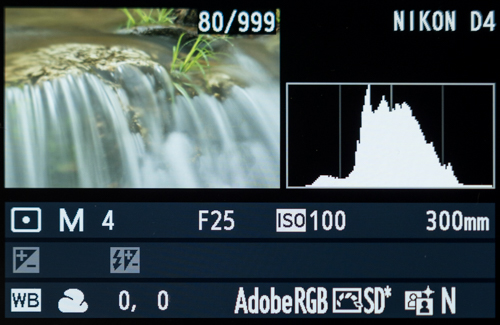
 One of the best ways to ensure a good exposure is to check the histogram in the playback mode. This handy tool can be found on just about every camera usually by cycling through the ‘display’ or ‘info’ button while in the Playback mode. Some cameras even offer a ‘live’ histogram so you can measure exposure before we take the photo.
The histogram shows how much data exists at each of the 256 levels of brightness. From 0 representing total black, to 255 representing absolute white, with 254 levels of gray in between. We can use it to make sure we haven’t over or under exposed our image but also, to make sure we have good data to work with in post processing.
To Check For Over Or Under Exposure
The key to reading the histogram is to look at the sides; the goal is to the keep the edges of the ‘mountain’ within the graph. If they hit the sides, it indicates missing information; if it hits the left side it indicates missing shadow information or ‘clipped’ shadows. If it’s hitting the right side, it indicates overexposure and clipped highlights. These clipped areas are like holes in our image, there is missing data which cannot be recovered.
- If we have clipped the bright or dark areas, we should consider adjusting our exposure settings and retaking the photo until it shows no clipping.
- If we have clipped in both the dark and the bright ends of the histogram, chose which is more important and adjust accordingly. Normally, we don’t want to see clipped highlights so making the exposure darker is often best.
- If we have specular highlights or street lights or such, we won’t worry about those being clipped unless they’re an important subject in our shot.
- The vertical amount shows how much of that tone there is at a particular brightness but is not significant for ensuring correct exposure.
To Check For A Good Exposure
In addition to making sure we haven’t over or under exposed, we can use the histogram to see if we have a good exposure and if there is room to make the image brighter.
Don’t trust the LCD screen when checking exposure. Some display darker and some lighter and it’s no way to gauge our exposure. If our LCD shows our image looking too bright, before retaking the photo and making it darker check the histogram first to confirm.
The histogram doesn’t lie. If we’re photographing a bright or normally lit scene and all the data is on the left side of our graph, that indicates we have underexposed the shot and have room to make the image lighter. We can change our exposure settings to add light and retake the photo.
This file (below) looked good on the camera LCD display but the histogram showed there was room to make it brighter and capture more data.

Slowing the shutter speed to let in more light helped capture a better exposure with more data to work with in post processing.
Expose To The Right
Expose To The Right (ETTR) is an important practice to follow. With this, we give the sensor as much exposure as we can, but not so much that we clip the bright portions of the scene that we want to preserve. We’ll see this in our histogram as data fully populating the right-hand side of the graph without hitting the edge.
We expose to the right because digital files record linear data where the brightest area can contain up to one half of all tonal information within the file. Therefore, there is more data to work with and manipulate with editing, especially if we need to make the file darker. Since there is so much less data in the darker side of a file, it’s difficult to stretch that data in editing, especially when trying to make the file brighter. Sliding that small amount of data to the right in editing will introduce graininess and noise in the file.
RGB Histogram
Most cameras display two types of histograms, a luminance histogram (the white graph) and an RGB Histogram (the red, green, blue graph). At the very least we should use the luminance histogram to check our exposure. However, depending on what we’re photographing, the RGB histogram might also be helpful.
If we clip or overexpose one of the color channels, it indicates there will be oversaturation and little texture or detail in that color. This is usually not a problem as long as the other two colors are not clipped but changing our exposure will give us a better file to work with in post processing, changing the camera’s white balance setting might also help.
Learning this one handy playback tool allows us to make the necessary adjustments to capture better exposed images. There is no one perfect histogram, it will vary for each subject or scene. The more we use it the more comfortable we’ll become understanding the information it provides us.